
jupyter labでplotlyを使用する場合、バージョンアップに伴って導入方法が変わっているようです。
以前の方法では、グラフが表示されない状態になってしまったため、2020年6月末時点での導入方法を紹介します。
問題
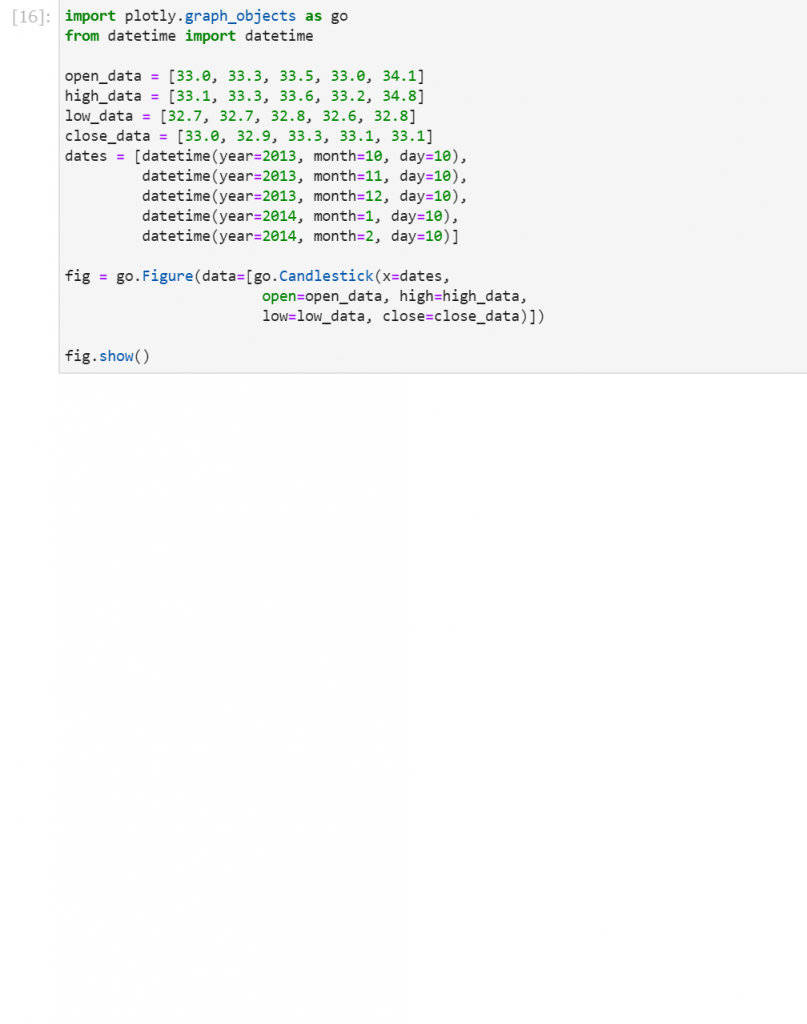
単純にplotlyをインストールするだけでは以下のように、何も表示されない状態でした。
インストール方法
jupyter labでplotlyを使用できるようにするためには、以下のような拡張機能とそれを使用するためのnodejsなどを導入する必要があるようです。
conda install -c plotly plotly=4.8.2
pip install jupyterlab "ipywidgets>=7.5"
conda install -c conda-forge nodejs
jupyter labextension install jupyterlab-plotly@4.8.2
jupyter labextension install @jupyter-widgets/jupyterlab-manager plotlywidget@4.8.2
以前のバージョンでは以下のようなコマンドを使用していたようですが最近ではサポート外となっているようです。
jupyter labextension install @jupyterlab/plotly-extension
参考
公式
Getting
Detailed examples of Getting Started with Plotly including changing color, size, log axes, and more in Python.
plotly.com


コメント